
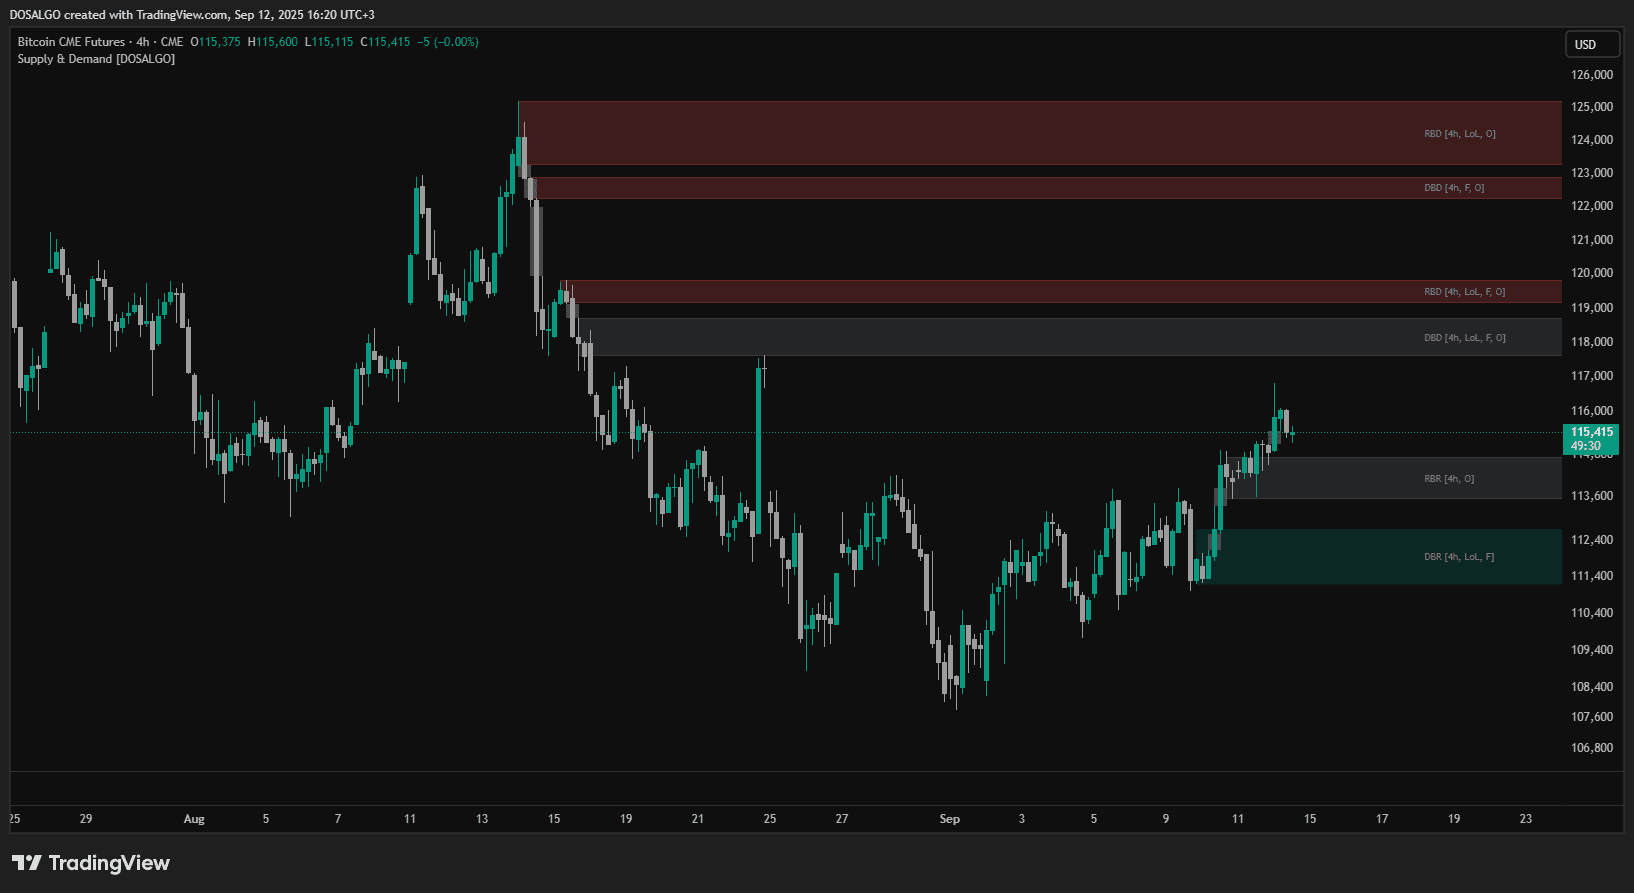
Stop spending hours manually drawing subjective support and resistance lines. Our Intelligent Supply & Demand indicator automatically scans the chart for high-probability zones where major market moves originate.
It identifies key reversal and continuation patterns, providing you with a consistent, objective, and professional-grade map of the most critical price levels on any asset, on any timeframe.
Automatically detects and draws high-probability supply and demand zones based on proven price action principles.
Uniquely identifies and displays price imbalances for an added layer of confluence used by smart money traders.
Display zones from higher timeframes directly on your chart, ensuring your trades are always aligned with the bigger picture.
Use a powerful suite of filters to display only the highest quality zones based on criteria like breakout strength and freshness.
Never miss a setup. Create custom alerts for when a new zone is formed or when price enters a key level for the first time.

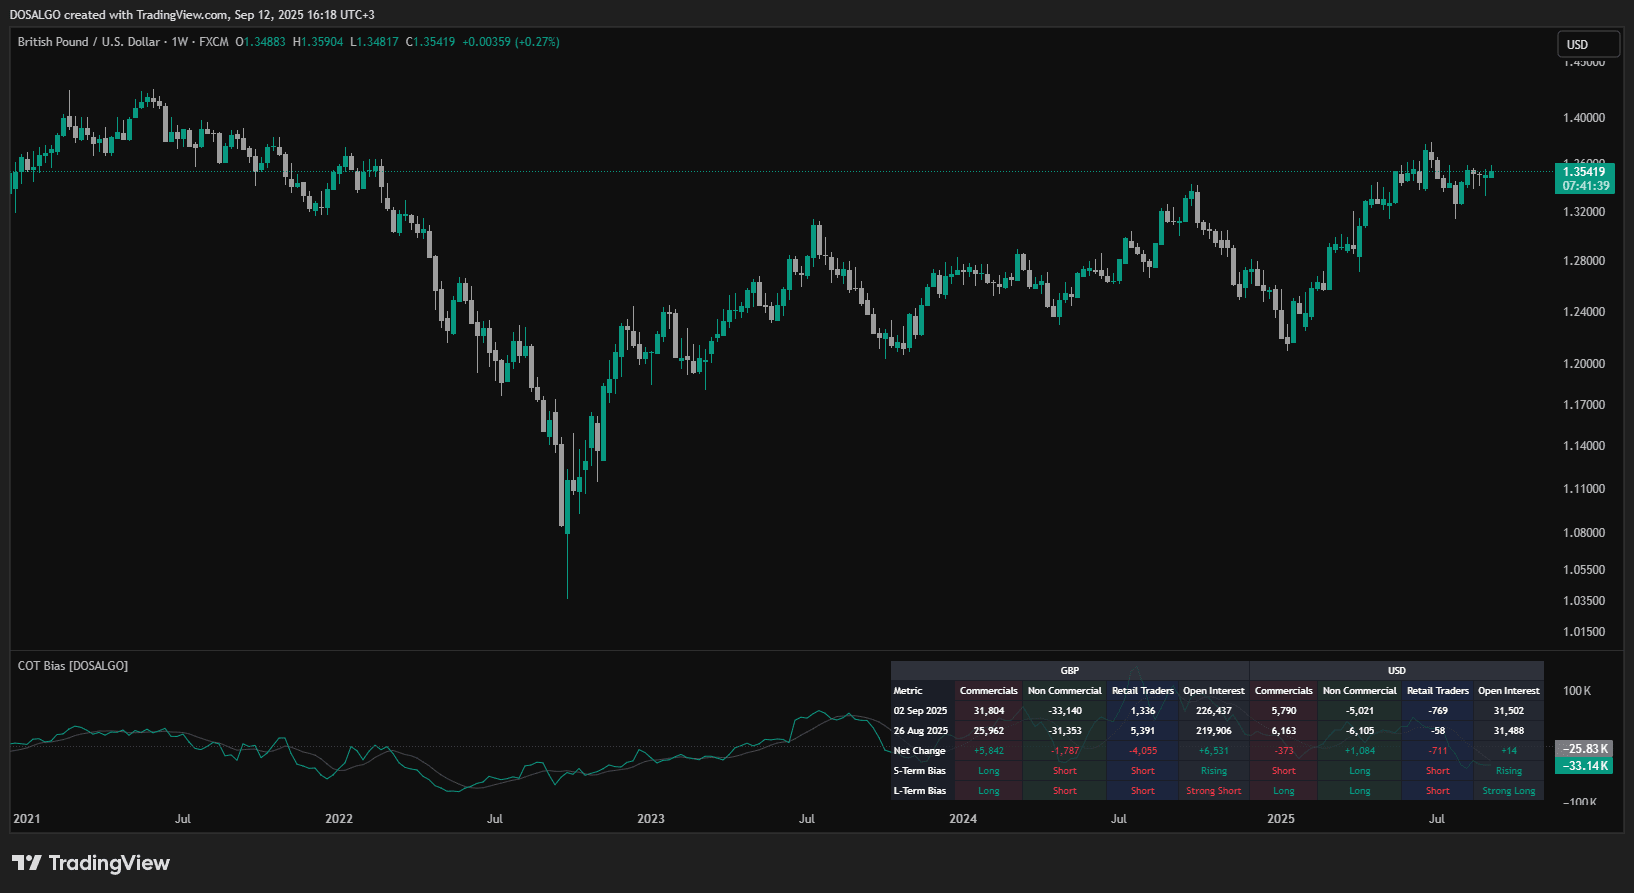
Price charts tell you what is happening, but they don’t tell you who is behind the moves. Our CoT Bias Tracker pulls back the curtain by showing you how hedge funds, corporations, and other large speculators are positioned in the market.
This institutional-grade data, derived from the official Commitment of Traders report, provides a powerful sentiment edge. We’ve transformed this complex information into a simple, at-a-glance dashboard, allowing you to align your trades with the “smart money” flow.
Get an instant summary of institutional positioning, weekly changes, and our proprietary bias ratings in a clean, professional on-screen table.
Uniquely see and compare the sentiment for BOTH currencies in a Forex pair (e.g., EUR and USD), giving you a true strength-vs-weakness view.
Go beyond raw data with clear Short-Term, Long-Term, and "Conviction" ratings that tell you the direction and strength of the institutional bias.
Plot historical positioning data as lines on your chart to identify sentiment extremes that have often coincided with major market tops and bottoms.
Utilize our proprietary POIV (Positioning and Open Interest Volume) metric to gauge the real force and conviction behind institutional money flow.

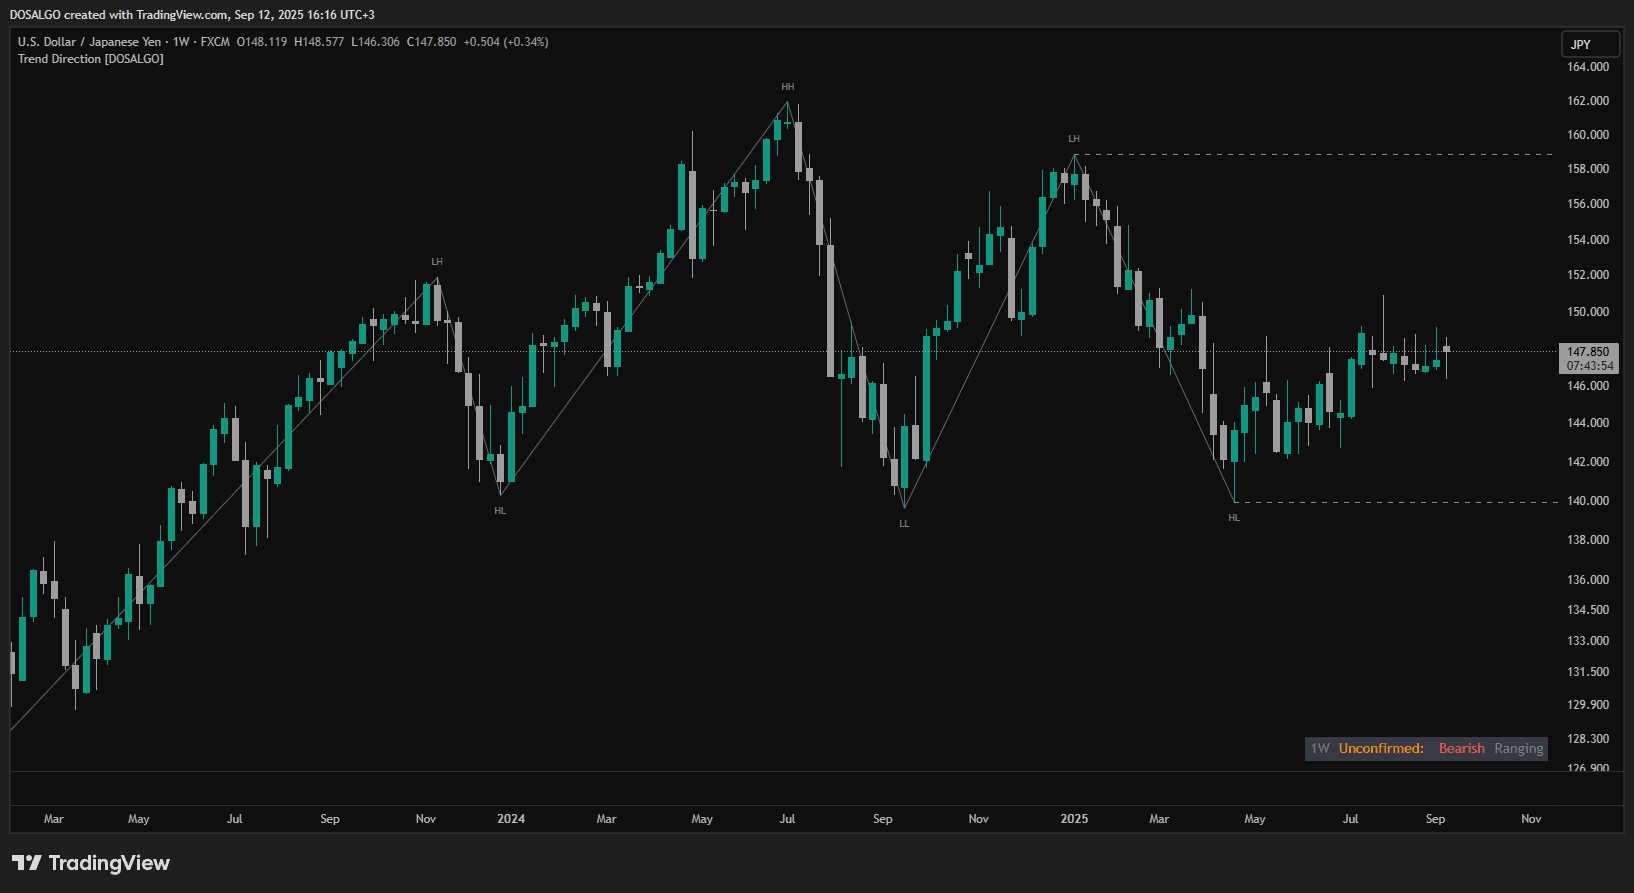
The first rule of trading is: “the trend is your friend.” But how do you objectively define the trend? Our Market Structure & Trend Direction indicator automates this foundational aspect of technical analysis.
It intelligently maps out the Higher Highs, Lower Lows, and other key swing points that define market structure. This powerful tool removes guesswork, providing a crystal-clear dashboard that tells you the definitive trend state of any asset, on any timeframe, ensuring you always trade with the dominant market flow.
Automatically plots key swing highs and lows, labeling them as HH, LL, HL, LH, to instantly reveal the market's underlying structure.
Get an at-a-glance summary of the current market state: Confirmed Bullish/Bearish or a crucial Unconfirmed early warning.
A unique feature that signals a potential trend change when a key structural level is broken, giving you a strategic head start.
Automatically draws and extends the horizontal price lines of the last significant swing high and swing low—your objective "lines in the sand."
Analyze the market structure of any timeframe (e.g., Daily) directly on your current chart, ensuring alignment with the higher-timeframe trend.

No asset moves in a vacuum. Its price is constantly influenced by the flow of money between different parts of the global financial system. Is the market currently in a “Risk-On” mood, favoring stocks and crypto, or “Risk-Off,” fleeing to the safety of bonds and gold?
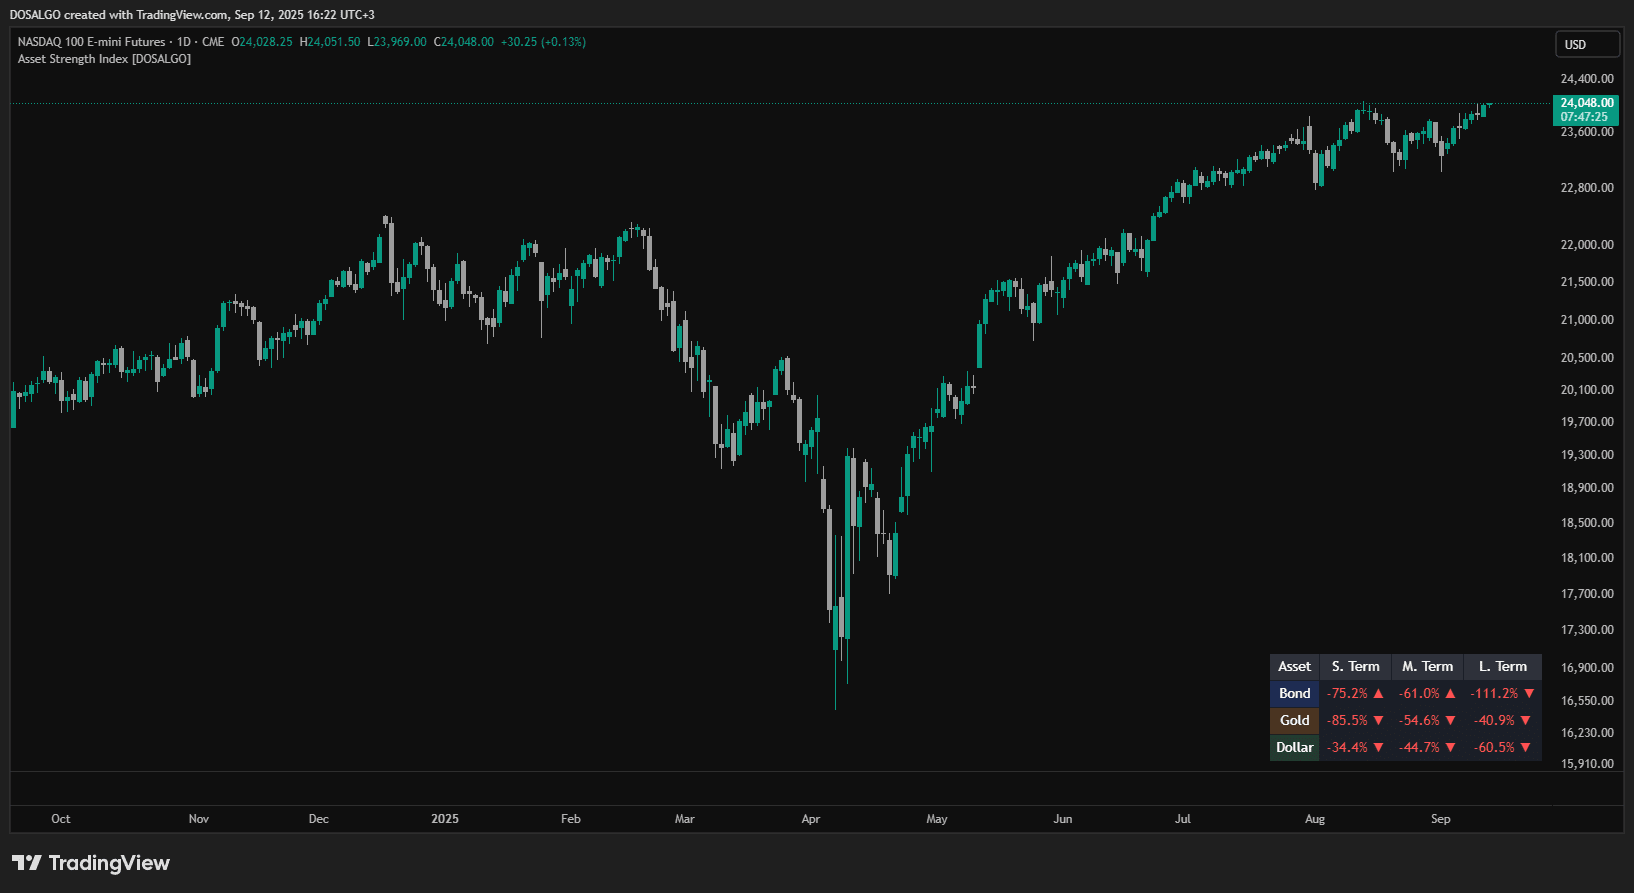
Our Asset Strength Index (ASI) answers this question for you. This powerful dashboard performs a sophisticated intermarket analysis, measuring your asset’s real-time strength against key global benchmarks to provide an instant and powerful sentiment reading directly on your chart.
Get an instant sentiment reading by seeing your asset's performance measured against a basket of key global assets: Bonds, Gold, and the US Dollar.
The color-coded dashboard gives you an immediate signal of market appetite, providing crucial context to confirm your trading ideas.
See the full picture with Short, Medium, and Long-Term strength scores displayed simultaneously for unparalleled market context.
Move beyond subjective analysis with clear percentage scores and momentum arrows that show the magnitude and direction of an asset's strength.
Let the indicator watch for major sentiment shifts for you, with custom alerts for when an asset reaches an extreme level of strength or weakness.

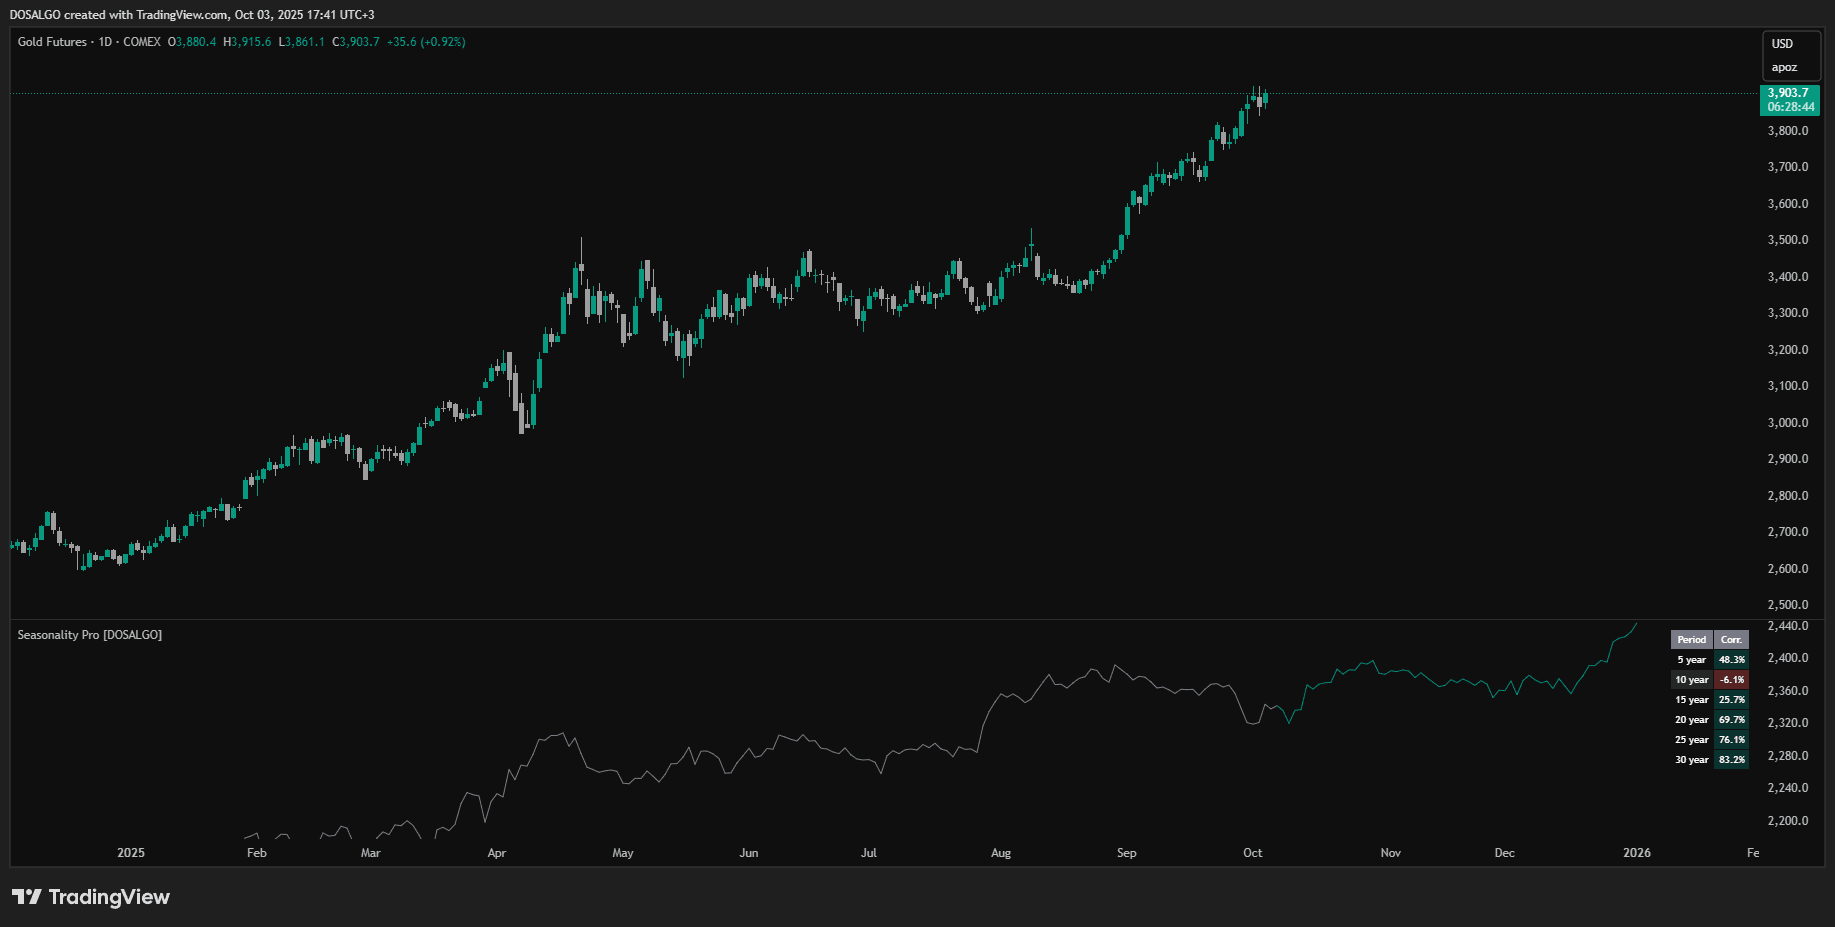
What if you could see a market’s most likely path for the year ahead, based on decades of historical data? Markets often follow predictable patterns, but these seasonal tides are nearly impossible to see without the right tools.
Seasonality Pro is your financial forecast engine. It crunches years of price history to reveal the hidden statistical probabilities that drive yearly trends. Stop guessing and start navigating the markets with a data-driven blueprint for what may come next.
Is the 5-year trend more powerful than the 30-year average? Our gauge lets you instantly compare different historical periods, revealing which seasonal pattern is dominating the market right now.
Get immediate visual feedback. The dashboard's intuitive, color-coded system tells you in a fraction of a second whether the current price is aligning with or defying its historical tendencies.
Chart a statistically-backed blueprint for the year ahead. Our engine projects the average historical price path, giving you a powerful visual guide. Refine your forecast further by isolating unique cycles, such as U.S. election years.
Trade with Statistical Certainty Replace emotional bias with hard data. The indicator provides precise percentage scores, giving you a quantifiable measure of confidence in a seasonal trend. Know your statistical edge before you place a trade.
Your personal market scout. Set your desired correlation level, and let the indicator notify you the moment a high-probability seasonal pattern emerges, so you can focus on execution.

Got questions? We’ve got answers. Explore common queries about our indicators, pricing, features, and support.
Our entire suite is designed exclusively for the TradingView platform.
No. Our signals, zones, and structural points are confirmed on bar close and do not repaint, ensuring you have reliable data for backtesting and live trading.
Yes. While the tools are professional-grade, we designed them with clear dashboards and visual aids that simplify complex data, making them accessible to traders of all skill levels.
You can use our indicators on any market available on TradingView, including Forex, Crypto, Stocks, Indices, and Commodities.
After subscribing, you will connect your TradingView username on our site. We will then grant you access to the indicators via TradingView's "invite-only scripts" feature within 48 hours.
Yes, you have full control over your subscription and can cancel at any time, no questions asked.